How to Query 100 Million Rows in Under a Second with ClickHouse
Learn what ClickHouse is, why it is fast, when to use it, and how to load 100 million rows and answer a dashboard question in about a third of a second.
A product dashboard shows the top pages on your site over the last seven days. Behind that single chart sit one hundred million page views, and every refresh leaves you waiting. ClickHouse answers the same question in about a third of a second on a laptop, with plain SQL.
ClickHouse is an open-source, column-oriented SQL database built for analytics. This guide explains what ClickHouse is, why it is fast, when it is the right choice, and when a transactional database fits better. You then install it, create a table designed around your questions, load one hundred million rows, and measure two real queries.
Understand What ClickHouse Is
This section defines ClickHouse and the kind of work it is designed for.
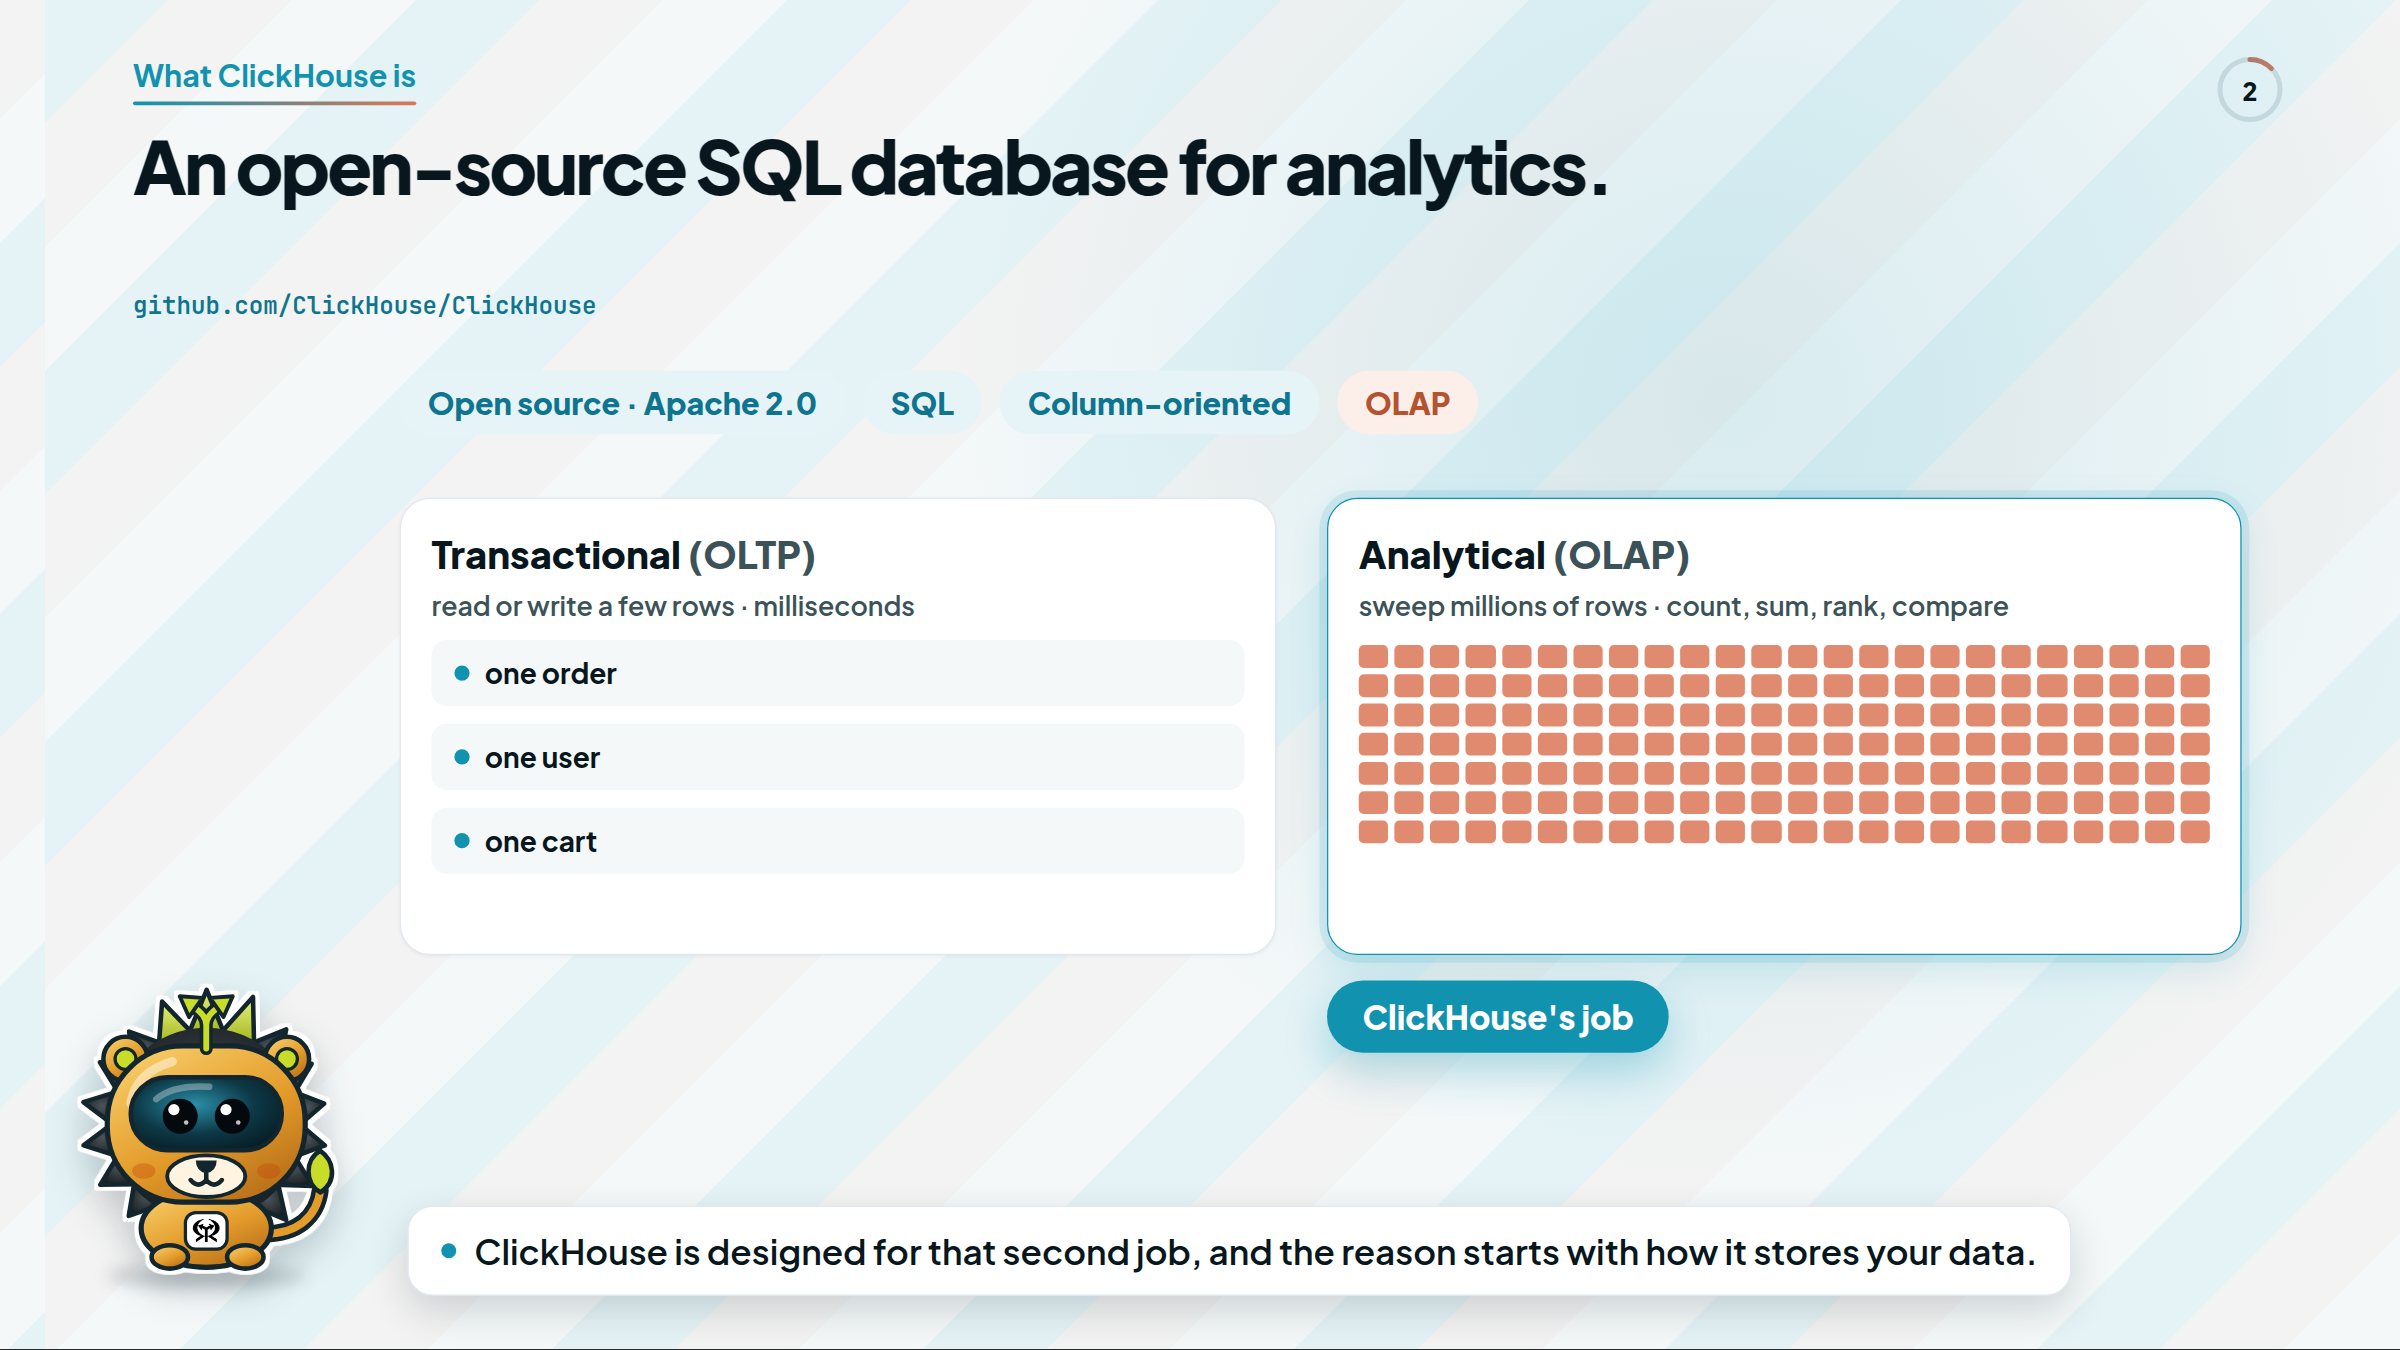
ClickHouse is an open-source database management system, licensed under Apache 2.0, for Online Analytical Processing (OLAP). It speaks SQL and stores data column by column.
Most application databases handle Online Transaction Processing (OLTP): they read or write a few rows at a time, such as one order or one user. Analytical queries are different. They sweep across millions or billions of rows to count, sum, rank, and compare, and they often need to answer in less than a second. ClickHouse is designed for that second job.
Learn Why Columns Make Analytics Fast
This section explains the storage choice behind ClickHouse's performance.
A row-oriented database stores each row together. That layout works well for fetching one complete record, but an analytical query that needs only two columns still reads every column of every row from disk.
ClickHouse stores each column separately, so a query reads only the columns it needs. Values of the same type sit next to each other, which helps compression and lets the processor work on them in batches. ClickHouse adds four more ideas on top of columnar storage:
- Parts and background merges. Each insert creates a small part on disk, and background merges combine parts later. Writes stay lightweight and do not block queries.
- Sorted data and skipping. Data is sorted by a key you choose, and ClickHouse skips blocks that cannot match a filter.
- Compression. Similar values stored together compress well, which saves disk space and speeds up scans.
- Vectorized, parallel execution. ClickHouse processes values in batches and spreads a single query across every CPU core.
Decide When ClickHouse Is the Right Choice
This section maps common workloads to ClickHouse and to the alternatives.
The ClickHouse documentation highlights four main use cases:
- Real-time analytics: customer-facing dashboards and live leaderboards over a continuous stream of events.
- Observability: logs, metrics, and traces in one database, so you can correlate them without pre-aggregation.
- Data warehousing: ClickHouse paired with open table formats, such as Iceberg, on object storage.
- Agentic analytics: AI agents that need high concurrency and full-fidelity data, querying ClickHouse directly, including over the Model Context Protocol (MCP).
ClickHouse is not a replacement for every database. If your application needs transactional state, such as a worker claiming a job or several records changing together with constraints enforced, use a transactional database such as Postgres. ClickHouse also favors appending data over constant row-by-row updates. Many teams run both: Postgres for application state and ClickHouse for analytics, with the needed tables replicated across. Row count alone does not decide the choice; your queries and correctness requirements do.
Prerequisites
Before you begin, you need:
- A Linux, macOS, or FreeBSD machine. On Windows, use the Windows Subsystem for Linux (WSL).
- A terminal with
curl. - About 250 MB of free disk space for the binary, plus roughly 1 GB for the example data.
Install ClickHouse
This section installs the single ClickHouse binary and starts a server.
-
Download the binary for your system:
$ curl https://clickhouse.com/ | shThe script selects the right build and saves a single file named
clickhousein the current directory. -
Start the server so your data persists between restarts:
$ ./clickhouse serverThe server stores its data in the current directory.
-
Open a second terminal in the same directory and check the connection:
$ ./clickhouse client --query "SELECT version()"The command prints the server version, for example
26.10.1.2511.
The same binary also runs clickhouse-local, a SQL engine for files that needs no server. The Query a File Without a Server section uses it.
Create a Table Designed Around Your Questions
This section creates the running example: page views for a web store.
-
Save the following table definition as
example.sql:CREATE TABLE page_views(ts DateTime,user_id UInt32,page LowCardinality(String),country LowCardinality(String),duration_ms UInt32)ENGINE = MergeTreeORDER BY (page, ts);MergeTreeis the main ClickHouse table engine and manages parts and merges.ORDER BY (page, ts)sorts the data on disk by page, then by time; choose this order based on the filters you use most.LowCardinalitystores columns with few distinct values, such as page names, as compact codes.
Load One Hundred Million Rows
This section generates realistic test data with a single insert statement.
-
Append this insert to
example.sql. It uses thenumberstable function to create one hundred million page views spread across the last thirty days:INSERT INTO page_viewsSELECTnow() - toIntervalSecond(rand(1) % (30 * 86400)) AS ts,rand(2) % 1000000 AS user_id,['/home', '/home', '/home', '/home', '/docs', '/docs', '/docs', '/pricing', '/pricing', '/blog', '/signup', '/checkout'][rand(3) % 12 + 1] AS page,['US', 'US', 'US', 'MX', 'MX', 'BR', 'ES', 'DE', 'IN', 'IN'][rand(4) % 10 + 1] AS country,rand(5) % 60000 AS duration_msFROM numbers(100000000);Each
rand(n)call uses a different argument, so the columns receive independent random values. -
Run the file:
$ ./clickhouse client --multiquery < example.sqlOn a 16-core laptop, the insert finishes in about 20 seconds.
-
Confirm the row count:
$ ./clickhouse client --query "SELECT count() FROM page_views"The output is
100000000.
Ask the Dashboard Question
This section runs the top-pages query and measures how much data it reads.
Before you run it, guess how many of the one hundred million rows a seven-day filter needs to read.
-
Run the query with timing and profile events enabled:
$ ./clickhouse client --time --print-profile-events --profile-events-delay-ms=-1 --query "SELECT page, count() AS views, uniq(user_id) AS visitors, round(avg(duration_ms) / 1000, 1) AS avg_seconds FROM page_views WHERE ts >= now() - INTERVAL 7 DAY GROUP BY page ORDER BY views DESC"The run in this guide returned the following, in 0.30 to 0.41 seconds:
/home 7778468 1001503 30/docs 5833597 998999 30/pricing 3889269 980906 30/checkout 1947108 858186 30/blog 1944268 859280 30/signup 1943348 857508 30The profile events report
SelectedRows: 24355072. ClickHouse read about 24.4 million rows instead of 100 million, because the data inside each page is sorted by time.uniqreturns an approximate distinct count, which is fast and accurate enough for dashboards.
Make the Sort Key Work for You
This section shows how a query that matches the sort key reads even less data.
-
Count checkouts by country:
$ ./clickhouse client --time --print-profile-events --profile-events-delay-ms=-1 --query "SELECT country, count() AS checkouts FROM page_views WHERE page = '/checkout' GROUP BY country ORDER BY checkouts DESC"The query returned US 2,500,870, IN 1,669,050, MX 1,665,220, BR 835,527, ES 834,682, and DE 832,776 in 0.036 seconds, with
SelectedRows: 8527872. Because the table is sorted by page first, every checkout row sits in one contiguous range. -
Inspect compression per column:
$ ./clickhouse client --query "SELECT name, formatReadableSize(data_compressed_bytes) AS on_disk, formatReadableSize(data_uncompressed_bytes) AS raw FROM system.columns WHERE table = 'page_views'"The sorted
pagecolumn stores 95.55 MiB of raw values in about 160 KiB. Random columns such asuser_idcompress far less; production data usually contains more patterns to exploit.
See the Skipping in the Query Plan
This section confirms, with the query plan, how the primary key avoids reading data.
ClickHouse divides each part into granules, blocks of 8,192 rows by default, and keeps a small sparse index with one entry per granule. A filter on the leading sort key column can use that index to find matching granules with a binary search instead of scanning the column.
-
Ask ClickHouse to explain the checkout query with index details:
$ ./clickhouse client --query "EXPLAIN indexes = 1 SELECT country, count() FROM page_views WHERE page = '/checkout' GROUP BY country"The relevant part of the output reads:
PrimaryKeyKeys:pageCondition: (page in ['/checkout', '/checkout'])Parts: 5/5Granules: 1022/12210Search Algorithm: binary searchThe plan selects 1,022 of 12,210 granules, about 8 % of the table. The part count depends on how far background merges have progressed, so your number of parts can differ.
-
Compare this with the seven-day query from the previous section. Time is the second sort key column, so ClickHouse can narrow the range only inside each page, which explains why it read about a quarter of the rows. If most of your dashboards filter by time first, a sort key such as
ORDER BY (ts, page)or a projection with a different order can serve them better. Test with your own queries before you decide.
Use EXPLAIN indexes = 1 whenever a query is slower than you expect. It shows whether the primary key participates and how many granules survive each index.
Query a File Without a Server
This section analyzes a CSV file directly with clickhouse-local.
-
Create a small
orders.csvfile:$ printf 'order_id,country,amount\n1,MX,120.50\n2,US,89.99\n3,MX,42.00\n4,ES,15.25\n5,US,240.00\n' > orders.csv -
Group and sum it with SQL:
$ ./clickhouse local --query "SELECT country, count() AS orders, sum(amount) AS revenue FROM file('orders.csv') GROUP BY country ORDER BY revenue DESC"The output lists US with 2 orders and 329.99 in revenue, MX with 2 and 162.5, and ES with 1 and 15.25. Tables you create in
clickhouse-localare temporary, so use the server when you want to keep data.
Choose a Deployment Mode
This section maps the ways to run ClickHouse to the situations they suit.
| Mode | Use it when |
|---|---|
| ClickHouse server | You operate ClickHouse on your own machines or clusters |
| ClickHouse Cloud | You want a managed service run by the ClickHouse team |
clickhouse-local | You analyze files or run scripts without a server |
| chDB | You embed the engine in an application or notebook |
Troubleshoot Common Problems
This section maps first-hour symptoms to their fixes.
| Symptom | Likely cause | Fix |
|---|---|---|
| Tables disappear after a restart | You created them in clickhouse-local, which uses temporary storage | Run ./clickhouse server and connect with ./clickhouse client |
| macOS refuses to open the binary | The system cannot verify the developer | Follow the developer-verification steps in the ClickHouse documentation |
| Inserts are slow or create many parts | Each single-row insert creates a separate part | Batch rows on the client, or enable asynchronous inserts |
| Queries read most of the table | The sort key does not match your common filters | Redesign ORDER BY around the filters you use most |
Conclusion
You now know that ClickHouse is an open-source columnar database for analytics, why columnar storage, sorting, compression, and vectorized execution make it fast, and when a transactional database such as Postgres fits better. You installed ClickHouse, loaded one hundred million rows in about twenty seconds, answered a dashboard question in about a third of a second, and saw a query that matches the sort key read 8.5 million rows instead of 100 million.
As a next step, pick one question your team asks every week and design a table around it, starting with the ORDER BY clause. For more guides like this one, visit La Rebelion Labs.